
✅作者简介:热爱科研的Matlab仿真开发者,修心和技术同步精进,matlab项目合作可私信。
🍎个人主页:Matlab科研工作室
🍊个人信条:格物致知。
更多Matlab完整代码及仿真定制内容点击👇
智能优化算法 神经网络预测 雷达通信 无线传感器 电力系统
信号处理 图像处理 路径规划 元胞自动机 无人机
🔥 内容介绍
在现代科技的不断发展中,无线传感器网络(Wireless Sensor Networks,简称WSN)已经成为了一个重要的研究领域。WSN由大量的无线传感器节点组成,这些节点可以自主地感知环境中的信息并将其传输到目的地。WSN的应用范围非常广泛,包括环境监测、智能交通、农业、医疗等领域。
然而,WSN也面临着一些挑战,其中之一就是异构性。异构无线传感器网络由不同类型的传感器节点组成,这些节点具有不同的能力和特性。例如,某些节点可能具有更高的计算能力和存储能力,而另一些节点可能只能提供基本的感知功能。这种异构性给网络的设计和管理带来了一定的困难。
为了克服异构无线传感器网络中的挑战,研究人员提出了多聚合器多链路由协议(Multi-Aggregator Multi-Path Routing Protocol,简称MAMPR)。MAMPR是一种分层路由协议,它将网络分为多个聚合器区域,并为每个区域选择一个聚合器节点。这些聚合器节点负责收集和聚合来自其所在区域的数据,并将数据传输到网络的其他部分。
MAMPR的设计目标是提高网络的能效和可靠性。为了实现这个目标,MAMPR采用了多路径路由的策略。传统的单路径路由协议容易受到链路中断或节点故障的影响,导致数据传输中断或丢失。而MAMPR通过使用多条路径来传输数据,可以提高数据传输的可靠性和稳定性。
另外,MAMPR还考虑了异构性对网络性能的影响。它根据节点的能力和特性,动态地选择合适的路径和聚合器节点。这样可以充分利用网络中各种类型的节点,提高网络的整体性能。
MAMPR的核心思想是聚合器区域的划分和路径选择。聚合器区域的划分可以根据节点的位置和能力进行,以便实现数据的有效聚合和传输。路径选择则是根据节点的能力和网络拓扑进行的,以确保数据能够按时、可靠地传输到目的地。
总之,多聚合器多链路由协议是一种用于解决异构无线传感器网络挑战的有效方法。它可以提高网络的能效和可靠性,充分利用网络中各种类型的节点,并实现数据的有效聚合和传输。随着无线传感器网络的发展和应用的不断扩大,MAMPR将会发挥越来越重要的作用。我们期待着更多关于MAMPR的研究和应用。
📣 部分代码
function varargout = fig3d(varargin)
% FIG3D MATLAB code for fig3d.fig
% FIG3D, by itself, creates a new FIG3D or raises the existing
% singleton*.
%
% H = FIG3D returns the handle to a new FIG3D or the handle to
% the existing singleton*.
%
% FIG3D('CALLBACK',hObject,eventData,handles,...) calls the local
% function named CALLBACK in FIG3D.M with the given input arguments.
%
% FIG3D('Property','Value',...) creates a new FIG3D or raises the
% existing singleton*. Starting from the left, property value pairs are
% applied to the GUI before fig3d_OpeningFcn gets called. An
% unrecognized property name or invalid value makes property application
% stop. All inputs are passed to fig3d_OpeningFcn via varargin.
%
% *See GUI Options on GUIDE's Tools menu. Choose "GUI allows only one
% instance to run (singleton)".
%
% See also: GUIDE, GUIDATA, GUIHANDLES
% Edit the above text to modify the response to help fig3d
% Last Modified by GUIDE v2.5 06-Oct-2021 22:13:58
% Begin initialization code - DO NOT EDIT
gui_Singleton = 1;
gui_State = struct('gui_Name', mfilename, ...
'gui_Singleton', gui_Singleton, ...
'gui_OpeningFcn', @fig3d_OpeningFcn, ...
'gui_OutputFcn', @fig3d_OutputFcn, ...
'gui_LayoutFcn', [] , ...
'gui_Callback', []);
if nargin && ischar(varargin{1})
gui_State.gui_Callback = str2func(varargin{1});
end
if nargout
[varargout{1:nargout}] = gui_mainfcn(gui_State, varargin{:});
else
gui_mainfcn(gui_State, varargin{:});
end
% End initialization code - DO NOT EDIT
% --- Executes just before fig3d is made visible.
function fig3d_OpeningFcn(hObject, eventdata, handles, varargin)
% This function has no output args, see OutputFcn.
% hObject handle to figure
% eventdata reserved - to be defined in a future version of MATLAB
% handles structure with handles and user data (see GUIDATA)
% varargin command line arguments to fig3d (see VARARGIN)
% Choose default command line output for fig3d
handles.output = hObject;
% Update handles structure
guidata(hObject, handles);
% UIWAIT makes fig3d wait for user response (see UIRESUME)
% uiwait(handles.figure1);
% --- Outputs from this function are returned to the command line.
function varargout = fig3d_OutputFcn(hObject, eventdata, handles)
% varargout cell array for returning output args (see VARARGOUT);
% hObject handle to figure
% eventdata reserved - to be defined in a future version of MATLAB
% handles structure with handles and user data (see GUIDATA)
% Get default command line output from handles structure
varargout{1} = handles.output;
global Nf Nresp Xcalname ycalname netname w_s0 ...
decides0 targets lows0 highs0 iplot varp ...
w_s0f decides0f targetsf lows0f highs0f surfi ...
pathname lowsf highsf ...
xplot1I xplot2I DplotI YplotrsI iplot
set(gcf,'Name','Plots','ToolBar','Figure','NumberTitle','off',...
'MenuBar','none')
set(handles.popupmenu1,'Value',iplot);
set(handles.popupmenu2,'Value',varp)
set(handles.popupmenu4,'Value',surfi)
strdes='Desirability';
for i=1:Nresp
strdes=[strdes,['|Response ',int2str(i)]];
end
set(handles.popupmenu1,'String',strdes)
decides=decides0-1;
w_s=w_s0;
lows=lows0;
highs=highs0;
decidesf=decides0f-1;
w_sf=w_s0f;
lowsf=lows0f;
highsf=highs0f;
xtemp=linspace(-1,1,15)';
switch Nf
case 2
xpun=[kron(xtemp,ones(15,1)),kron(ones(15,1),xtemp)];
case 3
xpun=[kron(xtemp,kron(ones(15,1),ones(15,1))),...
kron(ones(15,1),kron(xtemp,ones(15,1))),...
kron(ones(15,1),kron(ones(15,1),xtemp))];
case 4
xpun=[kron(kron(xtemp,kron(ones(15,1),ones(15,1))),ones(15,1)),...
kron(kron(ones(15,1),kron(xtemp,ones(15,1))),ones(15,1)),...
kron(kron(ones(15,1),kron(ones(15,1),xtemp)),ones(15,1)),...
kron(kron(ones(15,1),kron(ones(15,1),ones(15,1))),xtemp)];
end
gridsearch2
Npun=15;a=(Npun+1)/2;b=(Npun-1)/2;
xplot=linspace(-1,1,Npun);
switch Nf
case 2
imax=a+b*xpun(maxind,:);
Dplot=reshape(Des,15,15);
for i=1:Nresp
eval(['Yplotrs_temp=reshape((Yplot{',int2str(i),'}*deltay',int2str(i),'+MMy',int2str(i),')/2,15,15);']);
eval(['Yplotrs{',int2str(i),'}=Yplotrs_temp;']);
end
set(handles.popupmenu2,'Visible','off')
xplot1=(xplot*delta1f+MM1f)/2;
xplot2=(xplot*delta2f+MM2f)/2;
xlabel1='Factor 1';
ylabel1='Factor 2';
case 3
imax=a+b*xpun(maxind,:);
Dplot=reshape(Des,15,15,15);
switch varp
case 1
% 1&2
Dplot=squeeze(Dplot(imax(3),:,:));
for i=1:Nresp
eval(['Yplotrs_temp=reshape((Yplot{',int2str(i),'}*deltay',int2str(i),'+MMy',int2str(i),')/2,15,15,15);']);
Yplotrs_temp=squeeze(Yplotrs_temp(imax(3),:,:));
eval(['Yplotrs{',int2str(i),'}=Yplotrs_temp;']);
end
xplot1=(xplot*delta1f+MM1f)/2;
xplot2=(xplot*delta2f+MM2f)/2;
xlabel1='Factor 1';
ylabel1='Factor 2';
case 2
% 1&3
Dplot=squeeze(Dplot(:,imax(2),:));
for i=1:Nresp
eval(['Yplotrs_temp=reshape((Yplot{',int2str(i),'}*deltay',int2str(i),'+MMy',int2str(i),')/2,15,15,15);']);
Yplotrs_temp=squeeze(Yplotrs_temp(:,imax(2),:));
eval(['Yplotrs{',int2str(i),'}=Yplotrs_temp;']);
end
xplot1=(xplot*delta1f+MM1f)/2;
xplot2=(xplot*delta3f+MM3f)/2;
xlabel1='Factor 1';
ylabel1='Factor 3';
case 3
% 2&3
Dplot=squeeze(Dplot(:,:,imax(1)));
for i=1:Nresp
eval(['Yplotrs_temp=reshape((Yplot{',int2str(i),'}*deltay',int2str(i),'+MMy',int2str(i),')/2,15,15,15);']);
Yplotrs_temp=squeeze(Yplotrs_temp(:,:,imax(1)));
eval(['Yplotrs{',int2str(i),'}=Yplotrs_temp;']);
end
xplot1=(xplot*delta2f+MM2f)/2;
xplot2=(xplot*delta3f+MM3f)/2;
xlabel1='Factor 2';
ylabel1='Factor 3';
end
set(handles.popupmenu2,'Visible','on')
set(handles.popupmenu2,'String','Factors 1&2|Factors 1&3|Factors 2&3')
case 4
imax=[a+b*xpun(maxind,:)];
Dplot=reshape(Des,15,15,15,15);
switch varp
case 1
% 1&2
Dplot=squeeze(Dplot(imax(4),imax(3),:,:));
for i=1:Nresp
eval(['Yplotrs_temp=reshape((Yplot{',int2str(i),'}*deltay',int2str(i),'+MMy',int2str(i),')/2,15,15,15,15);']);
Yplotrs_temp=squeeze(Yplotrs_temp(imax(4),imax(3),:,:));
eval(['Yplotrs{',int2str(i),'}=Yplotrs_temp;']);
end
xplot1=(xplot*delta1f+MM1f)/2;
xplot2=(xplot*delta2f+MM2f)/2;
xlabel1='Factor 1';
ylabel1='Factor 2';
case 2
% 1&3
Dplot=squeeze(Dplot(imax(4),:,imax(2),:));
for i=1:Nresp
eval(['Yplotrs_temp=reshape((Yplot{',int2str(i),'}*deltay',int2str(i),'+MMy',int2str(i),')/2,15,15,15,15);']);
Yplotrs_temp=squeeze(Yplotrs_temp(imax(4),:,imax(2),:));
eval(['Yplotrs{',int2str(i),'}=Yplotrs_temp;']);
end
xplot1=(xplot*delta1f+MM1f)/2;
xplot2=(xplot*delta3f+MM3f)/2;
xlabel1='Factor 1';
ylabel1='Factor 3';
case 4
% 2&3
Dplot=squeeze(Dplot(imax(4),:,:,imax(1)));
for i=1:Nresp
eval(['Yplotrs_temp=reshape((Yplot{',int2str(i),'}*deltay',int2str(i),'+MMy',int2str(i),')/2,15,15,15,15);']);
Yplotrs_temp=squeeze(Yplotrs_temp(imax(4),:,:,imax(1)));
eval(['Yplotrs{',int2str(i),'}=Yplotrs_temp;']);
end
xplot1=(xplot*delta2f+MM2f)/2;
xplot2=(xplot*delta3f+MM3f)/2;
xlabel1='Factor 2';
ylabel1='Factor 3';
case 3
% 1&4
Dplot=squeeze(Dplot(:,imax(3),imax(2),:));
for i=1:Nresp
eval(['Yplotrs_temp=reshape((Yplot{',int2str(i),'}*deltay',int2str(i),'+MMy',int2str(i),')/2,15,15,15,15);']);
Yplotrs_temp=squeeze(Yplotrs_temp(:,imax(3),imax(2),:));
eval(['Yplotrs{',int2str(i),'}=Yplotrs_temp;']);
end
xplot1=(xplot*delta1f+MM1f)/2;
xplot2=(xplot*delta4f+MM4f)/2;
xlabel1='Factor 1';
ylabel1='Factor 4';
case 5
% 2&4
Dplot=squeeze(Dplot(:,imax(3),:,imax(1)));
for i=1:Nresp
eval(['Yplotrs_temp=reshape((Yplot{',int2str(i),'}*deltay',int2str(i),'+MMy',int2str(i),')/2,15,15,15,15);']);
Yplotrs_temp=squeeze(Yplotrs_temp(:,imax(3),:,imax(1)));
eval(['Yplotrs{',int2str(i),'}=Yplotrs_temp;']);
end
xplot1=(xplot*delta2f+MM2f)/2;
xplot2=(xplot*delta4f+MM4f)/2;
xlabel1='Factor 2';
ylabel1='Factor 4';
case 6
% 3&4
Dplot=squeeze(Dplot(:,:,imax(2),imax(1)));
for i=1:Nresp
eval(['Yplotrs_temp=reshape((Yplot{',int2str(i),'}*deltay',int2str(i),'+MMy',int2str(i),')/2,15,15,15,15);']);
Yplotrs_temp=squeeze(Yplotrs_temp(:,:,imax(2),imax(1)));
eval(['Yplotrs{',int2str(i),'}=Yplotrs_temp;']);
end
xplot1=(xplot*delta3f+MM3f)/2;
xplot2=(xplot*delta4f+MM4f)/2;
xlabel1='Factor 3';
ylabel1='Factor 4';
end
set(handles.popupmenu2,'Visible','on')
set(handles.popupmenu2,'String','Factors 1&2|Factors 1&3|Factors 1&4|Factors 2&3|Factors 2&4|Factors 3&4')
end
% Interpolation
[X,Y]=meshgrid(min(xplot1):(max(xplot1)-min(xplot1))/14:max(xplot1),...
min(xplot2):(max(xplot2)-min(xplot2))/14:max(xplot2));
[XI,YI]=meshgrid(min(xplot1):(max(xplot1)-min(xplot1))/50:max(xplot1),...
min(xplot2):(max(xplot2)-min(xplot2))/50:max(xplot2));
DplotI=interp2(X,Y,Dplot,XI,YI);
xplot1I=interp1(min(xplot1):(max(xplot1)-min(xplot1))/14:max(xplot1),...
xplot1,min(xplot1):(max(xplot1)-min(xplot1))/50:max(xplot1));
xplot2I=interp1(min(xplot2):(max(xplot2)-min(xplot2))/14:max(xplot2),...
xplot2,min(xplot2):(max(xplot2)-min(xplot2))/50:max(xplot2));
for i=1:Nresp
YplotrsI{i}=interp2(X,Y,Yplotrs{i},XI,YI);
end
if iplot==1
switch surfi
case 1
surf(xplot1I,xplot2I,DplotI,'Linewidth',0.5)
set(gca,'LineWidth',2)
case 2
if sum(Dplot(:))>0
[c,h]=contour(xplot1I,xplot2I,DplotI,20,'Linewidth',2);
clabel(c,h,'labelspacing',300);
set(gca,'LineWidth',2)
else
set(handles.popupmenu4,'Value',1);
end
case 3
if sum(Dplot(:))>0
contourf(xplot1I,xplot2I,DplotI,20,'Linewidth',1);colorbar;
set(gca,'LineWidth',2)
else
set(handles.popupmenu4,'Value',1);
end
end
title('Desirability','Fontsize',14)
else
switch surfi
case 1
surf(xplot1I,xplot2I,YplotrsI{iplot-1},'Linewidth',0.5)
set(gca,'LineWidth',2)
case 2
[c,h]=contour(xplot1I,xplot2I,YplotrsI{iplot-1},20,'Linewidth',2);
clabel(c,h,'labelspacing',300);
set(gca,'LineWidth',2)
case 3
[c,h]=contourf(xplot1I,xplot2I,YplotrsI{iplot-1},20,'Linewidth',1);colorbar;
set(gca,'LineWidth',2)
end
title(['Response ',int2str(iplot-1)],'Fontsize',14)
end
xlabel(xlabel1,'Fontsize',14)
ylabel(ylabel1,'Fontsize',14)
axis tight
% --- Executes during object creation, after setting all properties.
function figure1_CreateFcn(hObject, eventdata, handles)
% hObject handle to figure1 (see GCBO)
% eventdata reserved - to be defined in a future version of MATLAB
% handles empty - handles not created until after all CreateFcns called
% --- Executes on selection change in popupmenu1.
function popupmenu1_Callback(hObject, eventdata, handles)
% hObject handle to popupmenu1 (see GCBO)
% eventdata reserved - to be defined in a future version of MATLAB
% handles structure with handles and user data (see GUIDATA)
% Hints: contents = cellstr(get(hObject,'String')) returns popupmenu1 contents as cell array
% contents{get(hObject,'Value')} returns selected item from popupmenu1
global iplot varp
varp=get(handles.popupmenu2,'Value');
iplot=get(hObject,'Value');
% status=close(fig3d);
% if status==0
% close fig3d
% end
fig3d
% --- Executes during object creation, after setting all properties.
function popupmenu1_CreateFcn(hObject, eventdata, handles)
% hObject handle to popupmenu1 (see GCBO)
% eventdata reserved - to be defined in a future version of MATLAB
% handles empty - handles not created until after all CreateFcns called
% Hint: popupmenu controls usually have a white background on Windows.
% See ISPC and COMPUTER.
if ispc && isequal(get(hObject,'BackgroundColor'), get(0,'defaultUicontrolBackgroundColor'))
set(hObject,'BackgroundColor','white');
end
% --- Executes on selection change in popupmenu2.
function popupmenu2_Callback(hObject, eventdata, handles)
% hObject handle to popupmenu2 (see GCBO)
% eventdata reserved - to be defined in a future version of MATLAB
% handles structure with handles and user data (see GUIDATA)
% Hints: contents = cellstr(get(hObject,'String')) returns popupmenu2 contents as cell array
% contents{get(hObject,'Value')} returns selected item from popupmenu2
global varp
varp=get(handles.popupmenu2,'Value');
fig3d
% --- Executes during object creation, after setting all properties.
function popupmenu2_CreateFcn(hObject, eventdata, handles)
% hObject handle to popupmenu2 (see GCBO)
% eventdata reserved - to be defined in a future version of MATLAB
% handles empty - handles not created until after all CreateFcns called
% Hint: popupmenu controls usually have a white background on Windows.
% See ISPC and COMPUTER.
if ispc && isequal(get(hObject,'BackgroundColor'), get(0,'defaultUicontrolBackgroundColor'))
set(hObject,'BackgroundColor','white');
end
% --- Executes on selection change in popupmenu3.
function popupmenu3_Callback(hObject, eventdata, handles)
% hObject handle to popupmenu3 (see GCBO)
% eventdata reserved - to be defined in a future version of MATLAB
% handles structure with handles and user data (see GUIDATA)
% Hints: contents = cellstr(get(hObject,'String')) returns popupmenu3 contents as cell array
% contents{get(hObject,'Value')} returns selected item from popupmenu3
% --- Executes during object creation, after setting all properties.
function popupmenu3_CreateFcn(hObject, eventdata, handles)
% hObject handle to popupmenu3 (see GCBO)
% eventdata reserved - to be defined in a future version of MATLAB
% handles empty - handles not created until after all CreateFcns called
% Hint: popupmenu controls usually have a white background on Windows.
% See ISPC and COMPUTER.
if ispc && isequal(get(hObject,'BackgroundColor'), get(0,'defaultUicontrolBackgroundColor'))
set(hObject,'BackgroundColor','white');
end
% --- Executes on button press in pushbutton1.
function pushbutton1_Callback(hObject, eventdata, handles)
% hObject handle to pushbutton1 (see GCBO)
% eventdata reserved - to be defined in a future version of MATLAB
% handles structure with handles and user data (see GUIDATA)
% --- Executes on selection change in popupmenu4.
function popupmenu4_Callback(hObject, eventdata, handles)
% hObject handle to popupmenu4 (see GCBO)
% eventdata reserved - to be defined in a future version of MATLAB
% handles structure with handles and user data (see GUIDATA)
% Hints: contents = cellstr(get(hObject,'String')) returns popupmenu4 contents as cell array
% contents{get(hObject,'Value')} returns selected item from popupmenu4
global surfi
surfi=get(hObject,'Value');
fig3d
% --- Executes during object creation, after setting all properties.
function popupmenu4_CreateFcn(hObject, eventdata, handles)
% hObject handle to popupmenu4 (see GCBO)
% eventdata reserved - to be defined in a future version of MATLAB
% handles empty - handles not created until after all CreateFcns called
% Hint: popupmenu controls usually have a white background on Windows.
% See ISPC and COMPUTER.
if ispc && isequal(get(hObject,'BackgroundColor'), get(0,'defaultUicontrolBackgroundColor'))
set(hObject,'BackgroundColor','white');
end
% --- Executes on button press in pushbutton2.
function pushbutton2_Callback(hObject, eventdata, handles)
% hObject handle to pushbutton2 (see GCBO)
% eventdata reserved - to be defined in a future version of MATLAB
% handles structure with handles and user data (see GUIDATA)
global pathname
warning off
eval(['mkdir ','''',pathname,'temp',''''])
prompt={'Enter filename (default: .tiff)'};
dlgtitle='Save figure';
definput={'Figure'};
fina=inputdlg(prompt,dlgtitle,[1 40],definput);
eval(['print -dtiff -r200 ''',pathname,'\temp\',fina{1},'.tiff'''])
h=msgbox(['Figure saved in directory \temp as ',...
fina{1},'.tiff']);
prompt={'Enter filename (default: .txt)'};
dlgtitle='Save data';
definput={'Data'};
% --- Executes on button press in pushbutton3.
function pushbutton3_Callback(hObject, eventdata, handles)
% hObject handle to pushbutton3 (see GCBO)
% eventdata reserved - to be defined in a future version of MATLAB
% handles structure with handles and user data (see GUIDATA)
global pathname xplot1I xplot2I DplotI YplotrsI iplot
warning off
eval(['mkdir ','''',pathname,'temp',''''])
prompt={'Enter filename (default: .txt)'};
dlgtitle='Save data';
definput={'Data'};
fina=inputdlg(prompt,dlgtitle,[1 40],definput);
switch iplot
case 1
dataplot=[xplot1I',xplot2I',DplotI];
eval(['save ''',pathname,'\temp\',fina{1},'.txt''',' dataplot -ascii'])
otherwise
dataplot=[xplot1I',xplot2I',YplotrsI{iplot-1}];
eval(['save ''',pathname,'\temp\',fina{1},'.txt''',' dataplot -ascii'])
end
h=msgbox(['Data saved in directory \temp as ',...
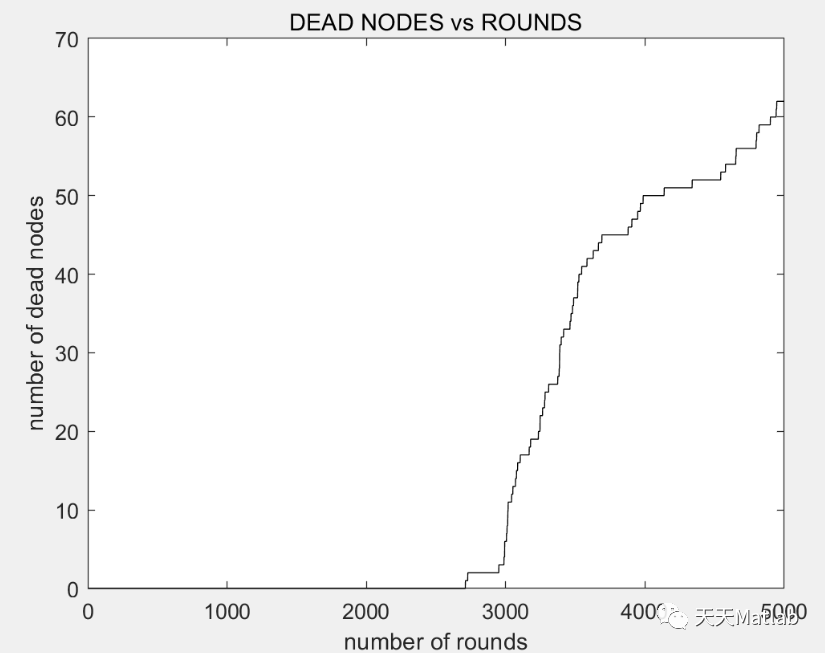
fina{1},'.txt in format [x axis,y axis,data matrix]']);⛳️ 运行结果
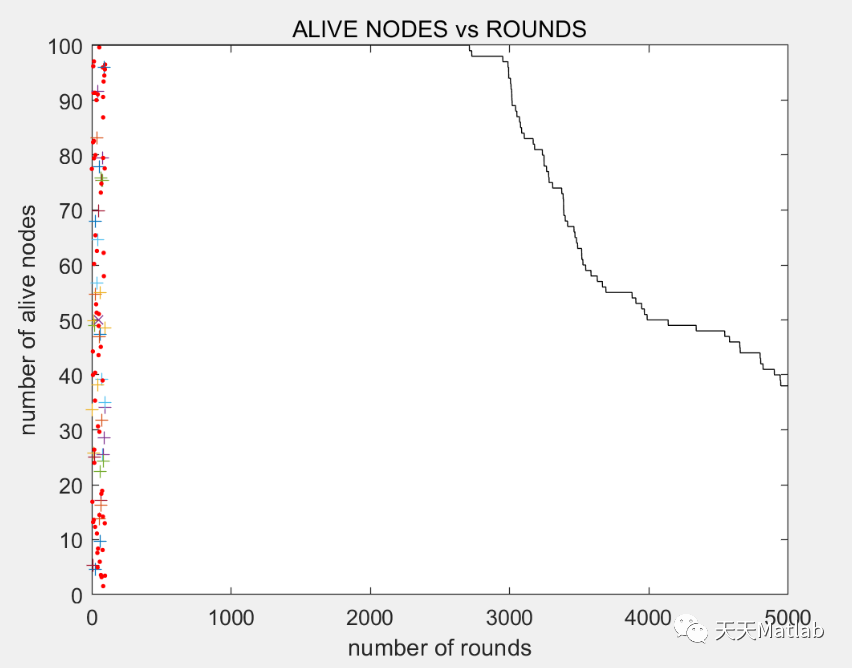
 编辑
编辑
 编辑
编辑
🔗 参考文献

 编辑
编辑
[1] 胡婷婷.基于异构无线传感器网络的混合路由设计与实现[D].北京交通大学,2015.
[2] 陈玲.异构无线传感器网络非均匀分区多跳路由协议的研究[D].武汉理工大学[2023-09-20].DOI:CNKI:CDMD:2.1015.810664.