prometheus: 192.168.2.110
node_exporter:192.168.2.111
grafana: 192.168.2.110
Prometheus 安装
1、下载解压
# 下载
wget https://github.com/prometheus/prometheus/releases/download/v2.13.0/prometheus-2.13.0.linux-amd64.tar.gz -P /usr/local/src

# 解压
tar -zxvf /usr/local/src/prometheus-2.13.0.linux-amd64.tar.gz -C /usr/local/

# 建立软链接
ln -s /usr/local/prometheus-2.13.0.linux-amd64/ /usr/local/prometheus
2、创建用户和数据存储目录
useradd -s /sbin/nologin -M prometheus

mkdir /usr/local/prometheus/data

chown -R prometheus:prometheus /usr/local/prometheus/
3、创建 Systemd 服务启动 prometheus
vim /etc/systemd/system/prometheus.service

[Unit]
Description=Prometheus
Documentation=https://prometheus.io/
After=network.target

[Service]
Type=simple
User=prometheus
ExecStart=/usr/local/prometheus/prometheus --config.file=/usr/local/prometheus/prometheus.yml --storage.tsdb.path=/usr/local/prometheus/data
Restart=on-failure

[Install]
WantedBy=multi-user.target
5、修改配置
# 备份
cp /usr/local/prometheus/prometheus.yml{,.bak}

# 增加被监控主机的 IP和端口号 node_exporter 默认端口号 9100
cat >> /usr/local/prometheus/prometheus.yml <<EOF

  - job_name: 'node-110'
    scrape_interval: 10s
    static_configs:
    - targets: ['192.168.2.110:9100']
      labels:
        instance: node-110
EOF
6、启动
systemctl start prometheus
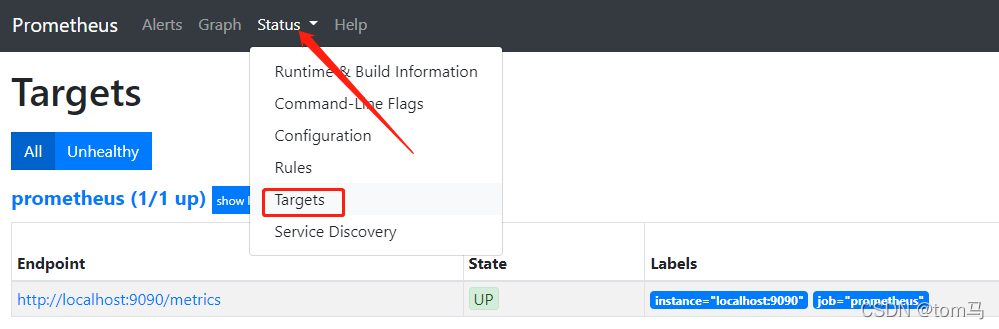
7、打开 prometheus 的 web 界面
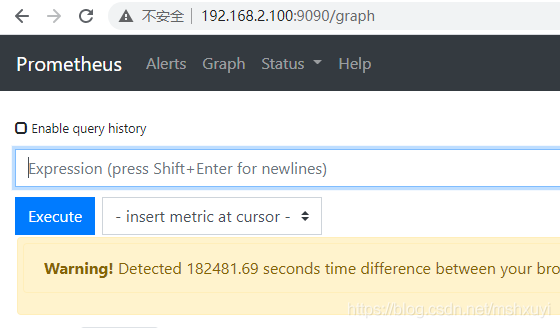
6、点击 Status > Targets,显示有一个 Endpoint,这个是 prometheus 自己的主机
Node Exporter 安装
与传统的监控 zabbix 来对比的话,prometheus-server 就像是 mysql,负责存储数据。只不过这是时序数据库而不是关系型的数据库。数据的收集还需要其他的客户端,在 prometheus中叫做 exporter。针对不同的服务,有各种各样的 exporter,就好比 zabbix 的 zabbix-agent一样。
采集主机的运行指标如 CPU, 内存,磁盘等信息。我们可以使用 Node Exporter。Node Exporter 同样采用 Golang 编写,并且不存在任何的第三方依赖,只需要下载,解压即可运行。
1、安装
# 下载
wget https://github.com/prometheus/node_exporter/releases/download/v0.18.1/node_exporter-0.18.1.linux-amd64.tar.gz -P /usr/local/src

# 解压
tar -zxvf /usr/local/src/node_exporter-0.18.1.linux-amd64.tar.gz -C /usr/local/

# 建立软链接
ln -s /usr/local/node_exporter-0.18.1.linux-amd64/ /usr/local/node_exporter
2、创建系统启动服务,默认是 9100 端口
cat >/usr/lib/systemd/system/node_exporter.service <<EOF
[Unit]
Description=node_exporter
Documentation=https://prometheus.io/
After=network.target

[Service]
Type=simple
User=prometheus
ExecStart=/usr/local/node_exporter/node_exporter
Restart=on-failure

[Install]
WantedBy=multi-user.target
EOF
3、启动
# 启动
systemctl start node_exporter

# 重启
systemctl restart prometheus
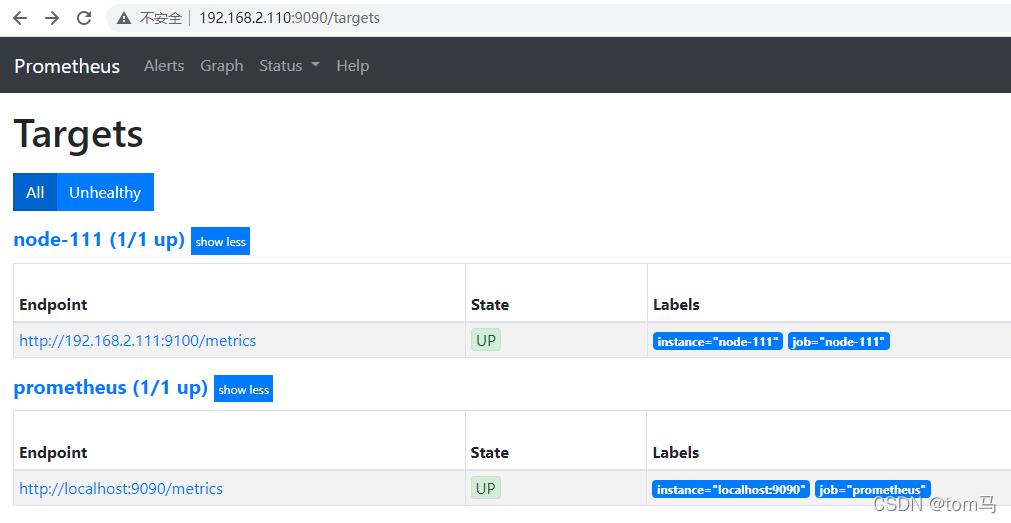
4、再次查看 prometheus 界面,node-111 主机已成功显示
Grafana 安装
1、下载与解压
# 下载
wget https://dl.grafana.com/oss/release/grafana-6.4.2.linux-amd64.tar.gz -C /usr/local/src

# 解压
tar -zxvf /usr/local/src/grafana-6.4.2.linux-amd64.tar.gz -C /usr/local/

# 建立软件链接
ln -s /usr/local/grafana-6.4.2/ /usr/local/grafana
2、创建用户与数据目录
useradd -s /sbin/nologin -M grafana

mkdir /usr/local/grafana/dat

chown -R grafana:grafana /usr/local/grafana/
3、检查配置文件
vim /usr/local/grafana/conf/defaults.ini

data = data
logs = data/log
plugins = data/plugins
provisioning = conf/provisioning
4、创建 Systemd 服务启动 grafana
vim /etc/systemd/system/grafana-server.service

[Unit]
Description=Grafana
After=network.target

[Service]
User=grafana
Group=grafana
Type=notify
ExecStart=/usr/local/grafana/bin/grafana-server -homepath /usr/local/grafana
Restart=on-failure

[Install]
WantedBy=multi-user.target
5、启动
systemctl start grafana-server
6、打开界面
http://192.168.2.100:3000/ 账号密码 admin/admin

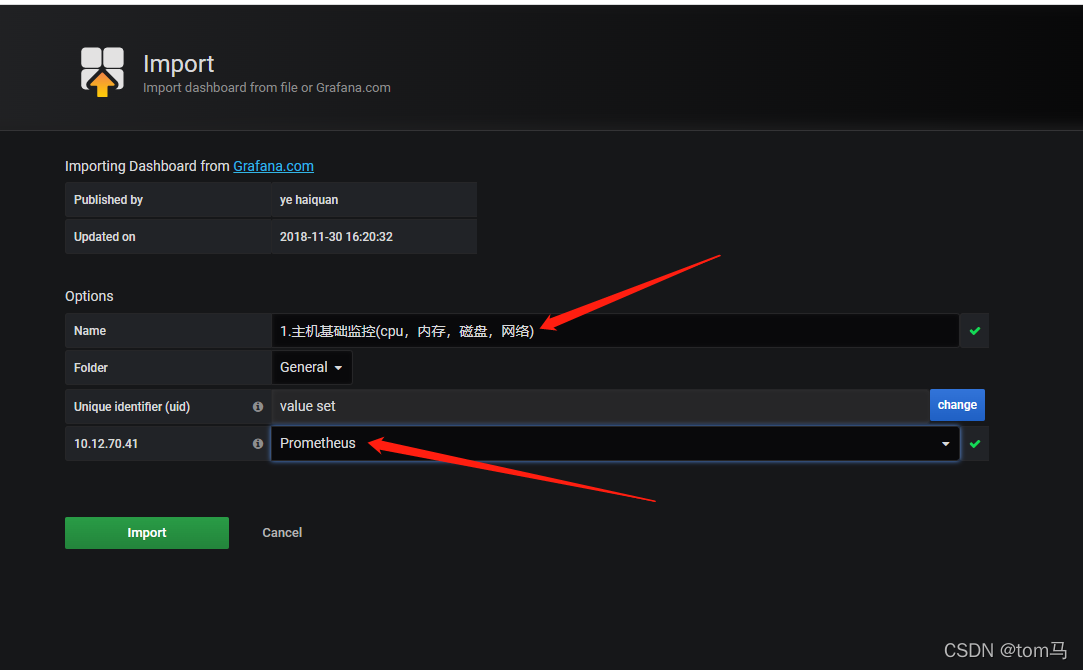
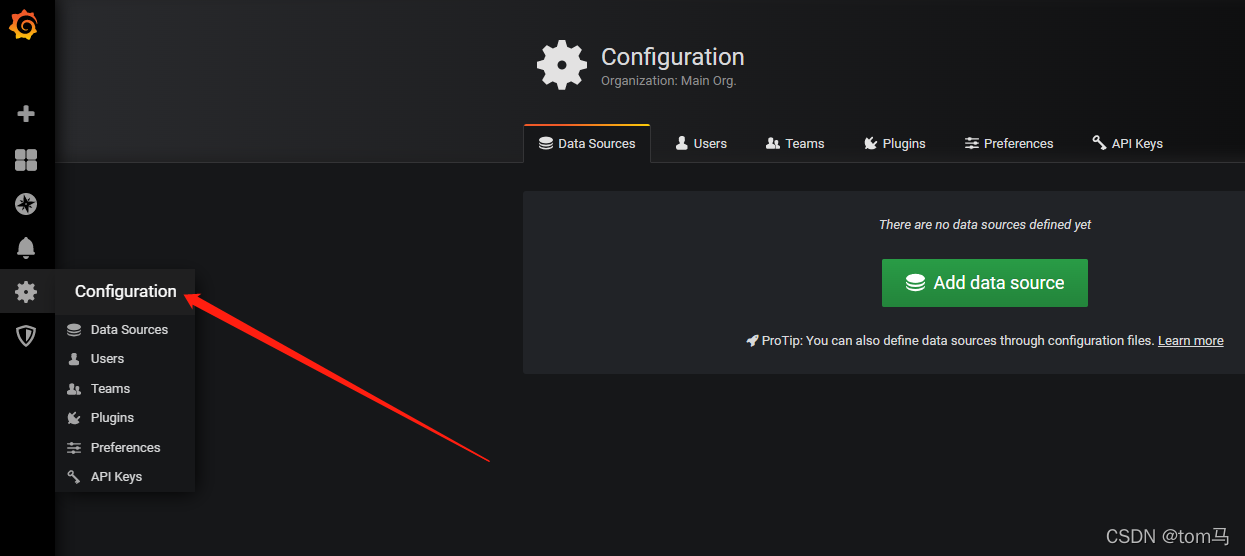
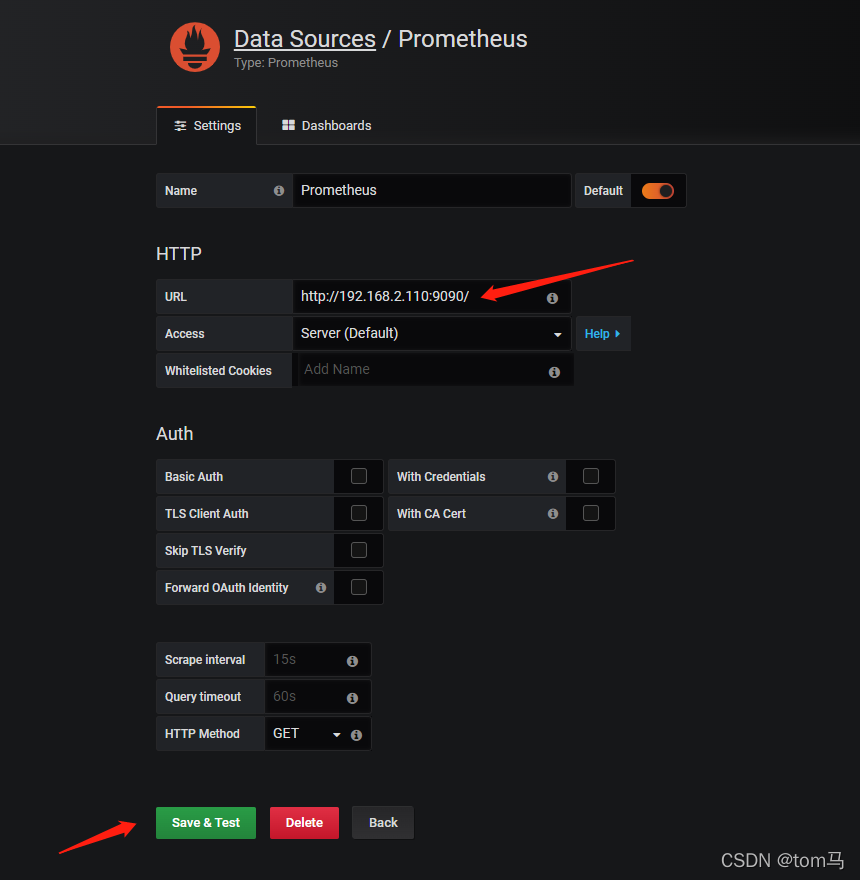
7、配置,添加数据源为 Prometheus
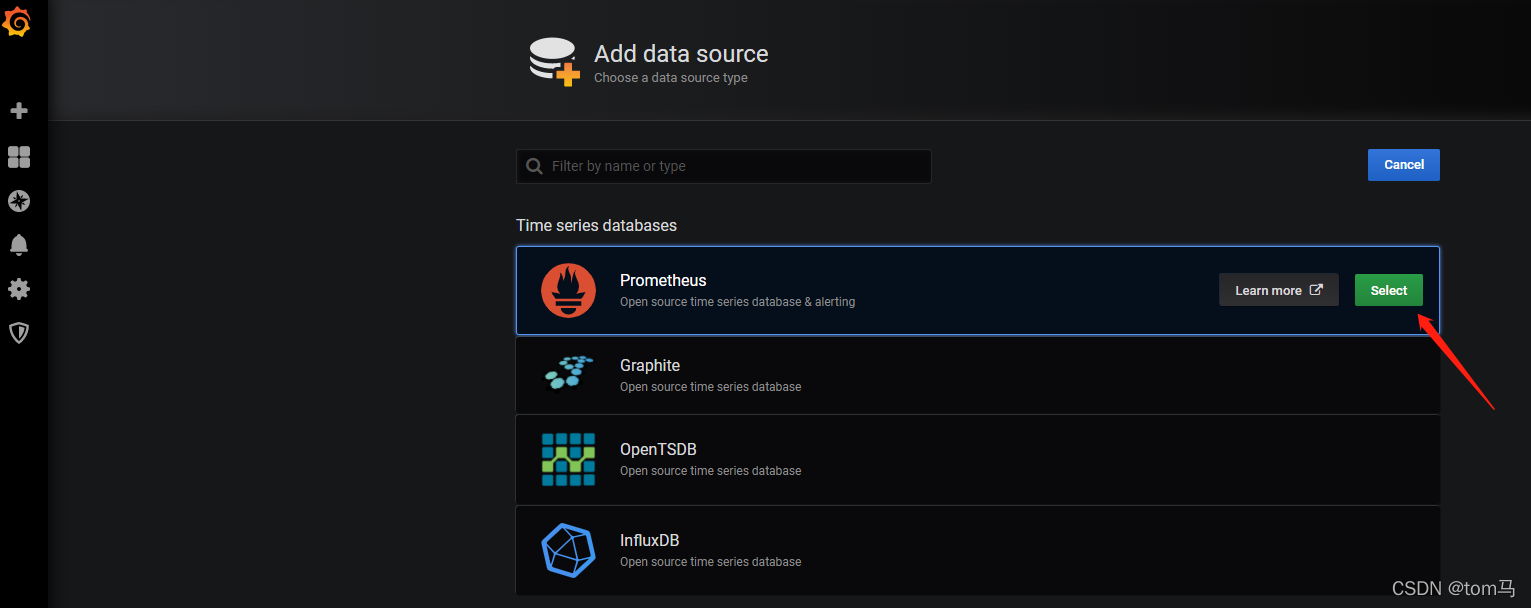
8、URL 选 192.168.2.100:9090,Name 为 Prometheus,Default 默认勾选
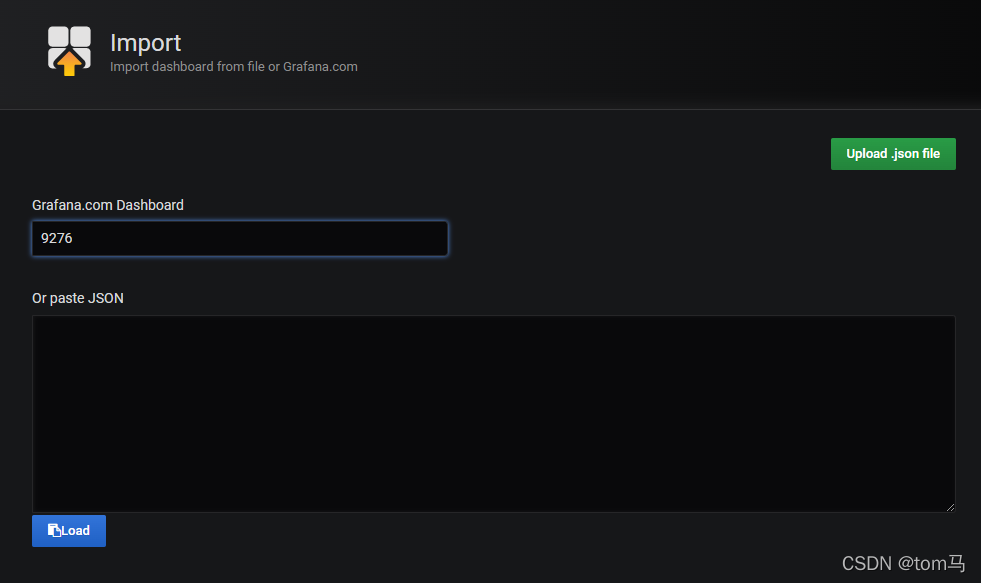
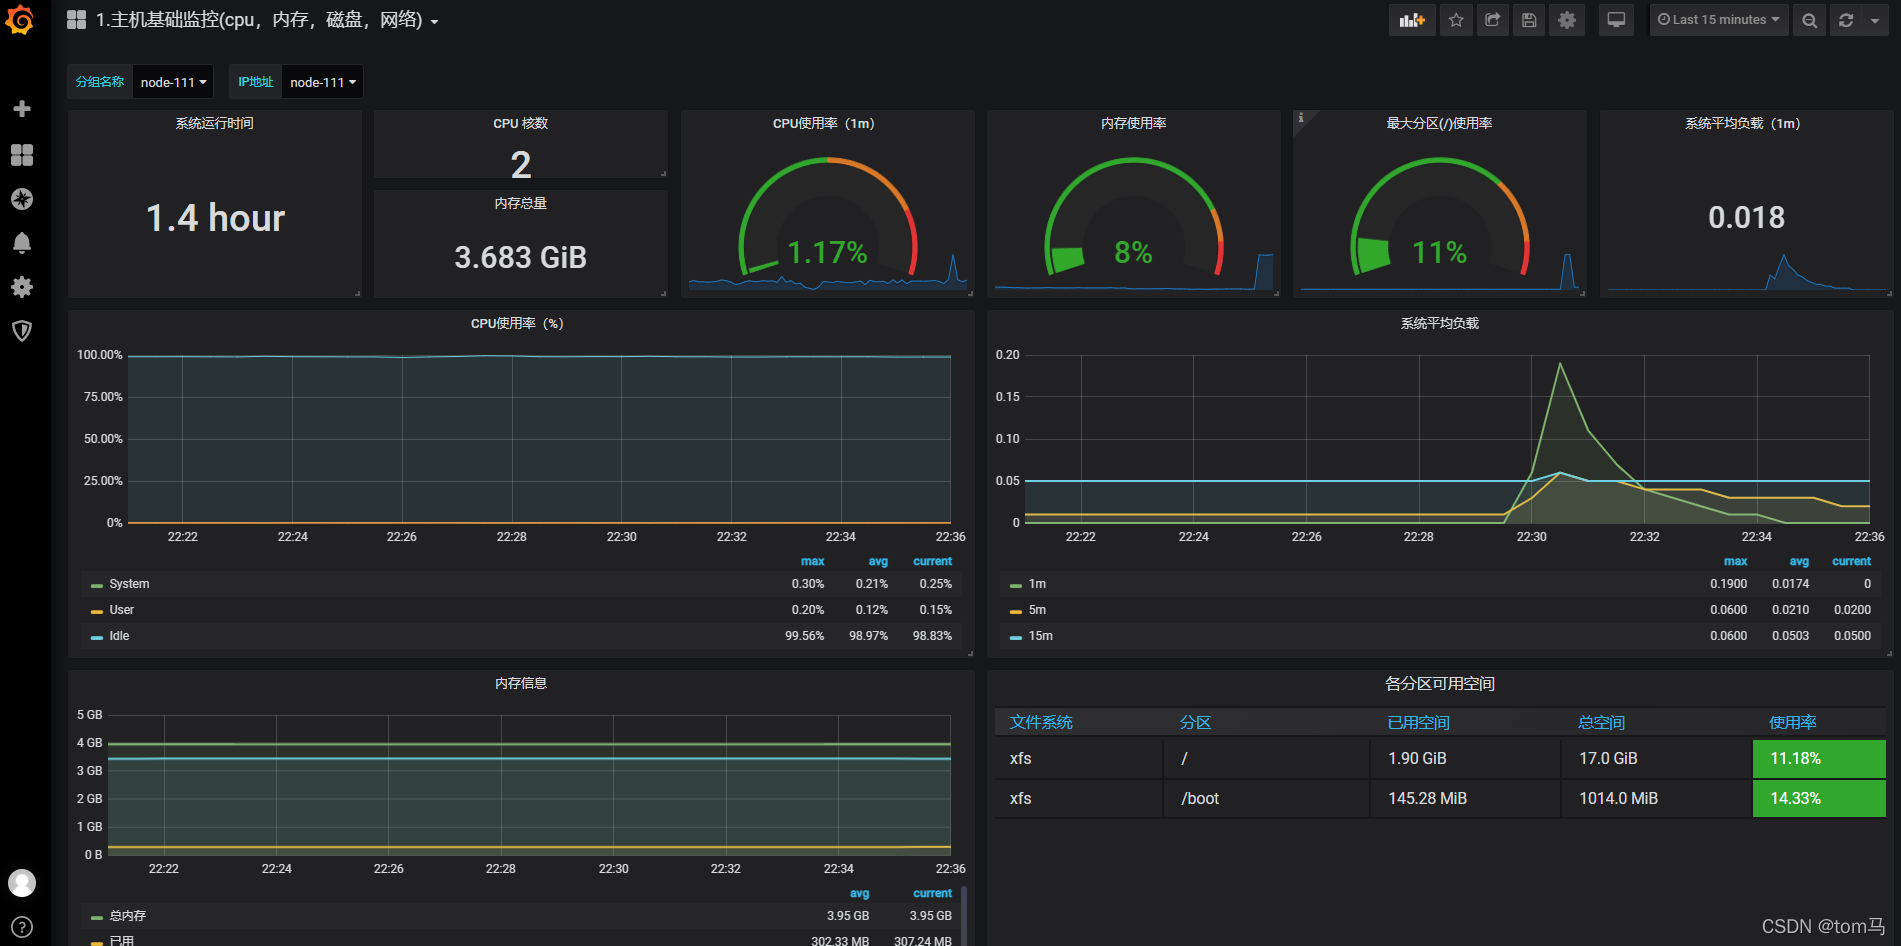
9、导入 Grafana 模版,你可以手动创建模版
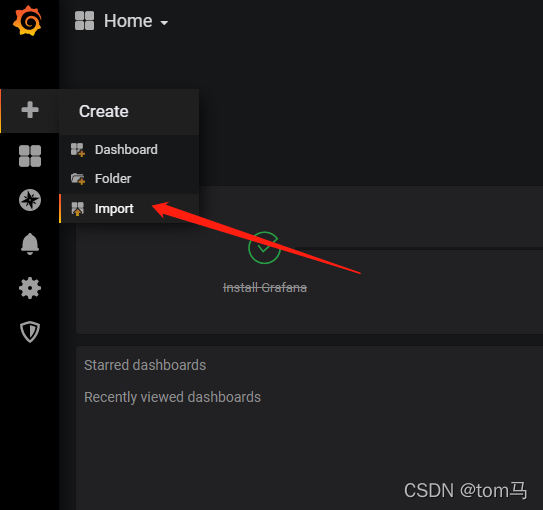
输入模板的编号,这里我使用的是9276号模板,如要使用其他的模板,请到grafana的官网去查找
https://grafana.com/grafana/dashboards/