文章目录
- Overview
- GNU `-fstack-usage` Compiler Option
- Creating Stack Report
- Assembly Code
- RTOS Tasks
- -Wstack-usage Warning
- Summary
- Links
- avstack.pl
Stack overflows are a big problem: If I see a system crash, the first thing usually is I try to increase the stack size to see if the problem goes away. The GNU linker can check if my global variables fit into RAM. But it cannot know how much stack I need. So how cool would it be to have a way to find out how much stack I need?

Static Stack Usage Analysis with GNU
And indeed, this is possible with the GNU tools (e.g. I’m using it with the GNU ARM Embedded (launchpad) 4.8 and 4.9 compilers ?. But it seems that this ability is not widely known?
Overview
One approach I have used for a very long time is:
- Fill the memory of the stack with a defined pattern.
- Let the application run.
- Check with the debugger how much of that stack pattern has been overwritten.
That works pretty good. Except it is very empirical. What I need is some numbers from the compiler to have a better view.
In this article I present an approach with GNU tools plus Perl script to report the stack usage in the application.
GNU -fstack-usage Compiler Option
The GNU compiler suite has an interesting option: -fstack-usage
-fstack-usage
- Makes the compiler output stack usage information for the program, on a per-function basis. The filename for the dump is made by appending .su to the auxname. auxname is generated from the name of the output file, if explicitly specified and it is not an executable, otherwise it is the basename of the source file. An entry is made up of three fields:
The name of the function. A number of bytes. One or more qualifiers: static, dynamic, bounded.
- The qualifier static means that the function manipulates the stack statically: a fixed number of bytes are allocated for the frame on function entry and released on function exit; no stack adjustments ar otherwise made in the function. The second field is this fixed number of bytes.
- The qualifier dynamic means that the function manipulates the stack dynamically: in addition to the static allocation described above, stack adjustments are made in the body of the function, fo example to push/pop arguments around function calls. If the qualifier bounded is also present, the amount of these adjustments is bounded at compile time and the second field is an upper bound of the total amount of stack used by the function. If it is not present, the amount of these adjustments is not bounded at compile time and the second field only represents the bounded part.
If I add that option to the compiler settings, there is now a .su (Stack Usage) file together with each object (.o) file:

Stack Usage File
The files are simple text files like this:
main.c:36:6:bar    48    static
main.c:41:5:foo    88    static
main.c:47:5:main    8    static
It lists the source file (main.c), the line (35) and column (5) position of the function, the function name (bar), the stack usage in bytes (48) and the allocation (static, this is the normal case).
Creating Stack Report
While the .su files already is a great source of information on a file/function basis, how to combine them to get the full picture? I have found a Perl script (avstack.pl) developed by Daniel Beer (see http://dlbeer.co.nz/oss/avstack.html).
From the original script, you might need to adapt the $objdump and $call_cost. With $objdump I specify the GNU objdump command (make sure it is present in the PATH) and $call_cost is a constant value added to the costs for each call:
my $objdump = "arm-none-eabi-objdump";
my $call_cost = 4;
Call avstack.pl with the list of object files, e.g.
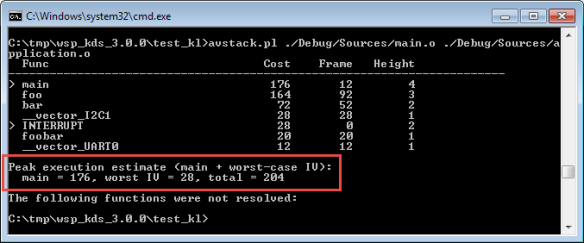
avstack.pl ./Debug/Sources/main.o ./Debug/Sources/application.o
You need to list all the object files, the script does not have a feature to use all the .o files in a directory. I usually put the call to the Perl file into a batch file which I call from a post-build step (see “Executing Multiple Commands as Post-Build Steps in Eclipse“).
This generates a report like this:
Func                               Cost    Frame   Height
------------------------------------------------------------------------
> main                                176       12        4
  foo                                 164       92        3
  bar                                  72       52        2
> INTERRUPT                            28        0        2
  __vector_I2C1                        28       28        1
  foobar                               20       20        1
R recursiveFunct                       20       20        1
  __vector_UART0                       12       12        1

Peak execution estimate (main + worst-case IV):
  main = 176, worst IV = 28, total = 204
- The function names with a ‘>’ in front show ‘root’ functions: they are not called from anywhere else (maybe I have not passed all the object files, or are really not used).
- If the function is recursive, it is marked with ‘R’. The cost estimate will be for a single level of recursion.
- Cost shows the cumulative stack usage (this function plus all the callees).
- Frame is the stack size used as in the .su file, including $call_cost constant.
- Height indicates the number of call levels which are caused by this function.
Notice the INTERRUPT entry: it is the level of stack needed by the interrupts. The tool assumes non-nested interrupts: it counts the worst case Interrupt Vector (IV) stack usage to the peak execution:
Peak execution estimate (main + worst-case IV):
  main = 176, worst IV = 28, total = 204
What is counted as interrupt routine is controlled by this part in the Perl script, so every function starting with _vector is treated as interrupt routine:
# Create fake edges and nodes to account for dynamic behaviour.
$call_graph{"INTERRUPT"} = {};

foreach (keys %call_graph) {
    $call_graph{"INTERRUPT"}->{$_} = 1 if /^__vector_/;
}
Assembly Code
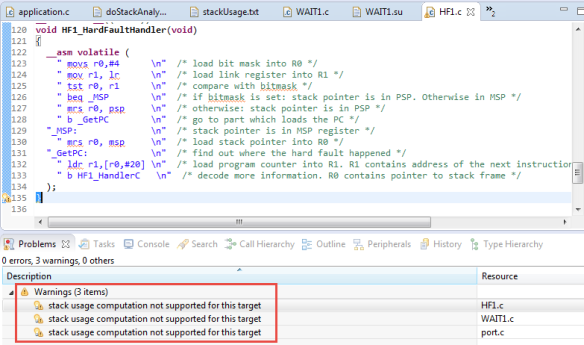
If I have inline assembly and assembly code in my project, then the compiler is not able to report the stack usage. These functions are reported with ‘zero’ stack usage:
Func                               Cost    Frame   Height
------------------------------------------------------------------------
> HF1_HardFaultHandler                  0        0        1
The compiler will warn me about it:

stack usage computation not supported for this target
I have not found a way to provide that information to the compiler in the source.
RTOS Tasks
The tool works nicely and out-of-the box for tasks in an RTOS (e.g. FreeRTOS) based system. So with the tool I get a good estimate of each task stack usage, but I need to count to that value the interrupt stack usage:
Func                               Cost    Frame   Height
------------------------------------------------------------------------
> ShellTask                           712       36       17
-Wstack-usage Warning
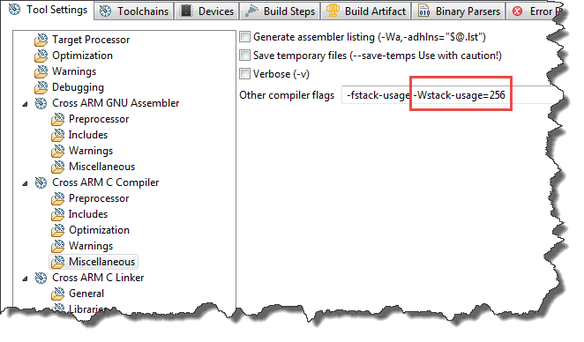
Another useful compiler option is -Wstack-usage. With this option the compiler will issue a warning whenever the stack usage exceeds a given limit.

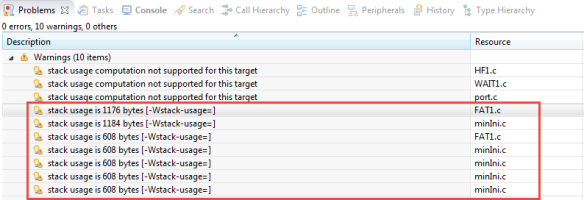
Option to warn about stack usageThat way I can quickly check which functions are exceeding a limit:

-Wstack-usage 只针对单个函数的堆栈用量,不会按调用树累计被调用函数的堆栈总数。
Summary
The GNU compiler suite comes with the very useful option -fstack-usage which produces text files for each compilation unit (source file) listing the stack usage. These files can be processed further, and I’m using the great Perl script created by Daniel Beer (Thanks!). With the presented tools and techniques, I get an estimate of the stack usage upfront. I’m aware that this is an estimate only, that recursion is only counted at a minimum level, and that assembly code is not counted in. I might extend the Perl file to scan folders for all the object files in it, unless someone already did this? If so, please post a comment and share ?.
Happy Stacking ?
UPDATE 24-Aug-2015: For all the C++ users: Daniel Beer has updated his article on http://www.dlbeer.co.nz/oss/avstack.html.
Links
- GNU -fstack-usage option (GNU Ada Page): https://gcc.gnu.org/onlinedocs/gnat_ugn/Static-Stack-Usage-Analysis.html
- Perl script to combine stack usage files by Daniel Beer: http://dlbeer.co.nz/oss/avstack.html
- Paper about stack analysis: http://www.adacore.com/uploads/technical-papers/Stack_Analysis.pdf
- Stack Analysis discussion in StackOverflow: http://stackoverflow.com/questions/126036/checking-stack-usage-at-compile-time
- Maximum stack size discussion in StackOverflow: http://stackoverflow.com/questions/6387614/how-to-determine-maximum-stack-usage-in-embedded-system-with-gcc
- Introcution of -Wstack-usage option: https://gcc.gnu.org/ml/gcc-patches/2011-03/msg01992.html
avstack.pl
#!/usr/bin/perl -w
# avstack.pl: AVR stack checker
# Copyright (C) 2013 Daniel Beer <dlbeer@gmail.com>
#
# Permission to use, copy, modify, and/or distribute this software for
# any purpose with or without fee is hereby granted, provided that the
# above copyright notice and this permission notice appear in all
# copies.
#
# THE SOFTWARE IS PROVIDED "AS IS" AND THE AUTHOR DISCLAIMS ALL
# WARRANTIES WITH REGARD TO THIS SOFTWARE INCLUDING ALL IMPLIED
# WARRANTIES OF MERCHANTABILITY AND FITNESS. IN NO EVENT SHALL THE
# AUTHOR BE LIABLE FOR ANY SPECIAL, DIRECT, INDIRECT, OR CONSEQUENTIAL
# DAMAGES OR ANY DAMAGES WHATSOEVER RESULTING FROM LOSS OF USE, DATA OR
# PROFITS, WHETHER IN AN ACTION OF CONTRACT, NEGLIGENCE OR OTHER
# TORTIOUS ACTION, ARISING OUT OF OR IN CONNECTION WITH THE USE OR
# PERFORMANCE OF THIS SOFTWARE.
#
# Usage
# -----
#
# This script requires that you compile your code with -fstack-usage.
# This results in GCC generating a .su file for each .o file. Once you
# have these, do:
#
#    ./avstack.pl <object files>
#
# This will disassemble .o files to construct a call graph, and read
# frame size information from .su. The call graph is traced to find, for
# each function:
#
#    - Call height: the maximum call height of any callee, plus 1
#      (defined to be 1 for any function which has no callees).
#
#    - Inherited frame: the maximum *inherited* frame of any callee, plus
#      the GCC-calculated frame size of the function in question.
#
# Using these two pieces of information, we calculate a cost (estimated
# peak stack usage) for calling the function. Functions are then listed
# on stdout in decreasing order of cost.
#
# Functions which are recursive are marked with an 'R' to the left of
# them. Their cost is calculated for a single level of recursion.
#
# The peak stack usage of your entire program can usually be estimated
# as the stack cost of "main", plus the maximum stack cost of any
# interrupt handler which might execute.

use strict;

# Configuration: set these as appropriate for your architecture/project.

my $objdump = "avr-objdump";
my $call_cost = 4;

# First, we need to read all object and corresponding .su files. We're
# gathering a mapping of functions to callees and functions to frame
# sizes. We're just parsing at this stage -- callee name resolution
# comes later.

my %frame_size;     # "func@file" -> size
my %call_graph;     # "func@file" -> {callees}
my %addresses;      # "addr@file" -> "func@file"

my %global_name;    # "func" -> "func@file"
my %ambiguous;      # "func" -> 1

foreach (@ARGV) {
    # Disassemble this object file to obtain a callees. Sources in the
    # call graph are named "func@file". Targets in the call graph are
    # named either "offset@file" or "funcname". We also keep a list of
    # the addresses and names of each function we encounter.
    my $objfile = $_;
    my $source;

    open(DISASSEMBLY, "$objdump -dr $objfile|") ||
    die "Can't disassemble $objfile";
    while (<DISASSEMBLY>) {
    chomp;

    if (/^([0-9a-fA-F]+) <(.*)>:/) {
        my $a = $1;
        my $name = $2;

        $source = "$name\@$objfile";
        $call_graph{$source} = {};
        $ambiguous{$name} = 1 if defined($global_name{$name});
        $global_name{$name} = "$name\@$objfile";

        $a =~ s/^0*//;
        $addresses{"$a\@$objfile"} = "$name\@$objfile";
    }

    if (/: R_[A-Za-z0-9_]+_CALL[ \t]+(.*)/) {
        my $t = $1;

        if ($t eq ".text") {
        $t = "\@$objfile";
        } elsif ($t =~ /^\.text\+0x(.*)$/) {
        $t = "$1\@$objfile";
        }

        $call_graph{$source}->{$t} = 1;
    }
    }
    close(DISASSEMBLY);

    # Extract frame sizes from the corresponding .su file.
    if ($objfile =~ /^(.*).o$/) {
    my $sufile = "$1.su";

    open(SUFILE, "<$sufile") || die "Can't open $sufile";
    while (<SUFILE>) {
        $frame_size{"$1\@$objfile"} = $2 + $call_cost
        if /^.*:([^\t ]+)[ \t]+([0-9]+)/;
    }
    close(SUFILE);
    }
}

# In this step, we enumerate each list of callees in the call graph and
# try to resolve the symbols. We omit ones we can't resolve, but keep a
# set of them anyway.

my %unresolved;

foreach (keys %call_graph) {
    my $from = $_;
    my $callees = $call_graph{$from};
    my %resolved;

    foreach (keys %$callees) {
    my $t = $_;

    if (defined($addresses{$t})) {
        $resolved{$addresses{$t}} = 1;
    } elsif (defined($global_name{$t})) {
        $resolved{$global_name{$t}} = 1;
        warn "Ambiguous resolution: $t" if defined ($ambiguous{$t});
    } elsif (defined($call_graph{$t})) {
        $resolved{$t} = 1;
    } else {
        $unresolved{$t} = 1;
    }
    }

    $call_graph{$from} = \%resolved;
}

# Create fake edges and nodes to account for dynamic behaviour.
$call_graph{"INTERRUPT"} = {};

foreach (keys %call_graph) {
    $call_graph{"INTERRUPT"}->{$_} = 1 if /^__vector_/;
}

# Trace the call graph and calculate, for each function:
#
#    - inherited frames: maximum inherited frame of callees, plus own
#      frame size.
#    - height: maximum height of callees, plus one.
#    - recursion: is the function called recursively (including indirect
#      recursion)?

my %has_caller;
my %visited;
my %total_cost;
my %call_depth;

sub trace {
    my $f = shift;

    if ($visited{$f}) {
    $visited{$f} = "R" if $visited{$f} eq "?";
    return;
    }

    $visited{$f} = "?";

    my $max_depth = 0;
    my $max_frame = 0;

    my $targets = $call_graph{$f} || die "Unknown function: $f";
    if (defined($targets)) {
    foreach (keys %$targets) {
        my $t = $_;

        $has_caller{$t} = 1;
        trace($t);

        my $is = $total_cost{$t};
        my $d = $call_depth{$t};

        $max_frame = $is if $is > $max_frame;
        $max_depth = $d if $d > $max_depth;
    }
    }

    $call_depth{$f} = $max_depth + 1;
    $total_cost{$f} = $max_frame + ($frame_size{$f} || 0);
    $visited{$f} = " " if $visited{$f} eq "?";
}

foreach (keys %call_graph) { trace $_; }

# Now, print results in a nice table.
printf "  %-30s %8s %8s %8s\n",
    "Func", "Cost", "Frame", "Height";
print "------------------------------------";
print "------------------------------------\n";

my $max_iv = 0;
my $main = 0;

foreach (sort { $total_cost{$b} <=> $total_cost{$a} } keys %visited) {
    my $name = $_;

    if (/^(.*)@(.*)$/) {
    $name = $1 unless $ambiguous{$name};
    }

    my $tag = $visited{$_};
    my $cost = $total_cost{$_};

    $name = $_ if $ambiguous{$name};
    $tag = ">" unless $has_caller{$_};

    if (/^__vector_/) {
    $max_iv = $cost if $cost > $max_iv;
    } elsif (/^main@/) {
    $main = $cost;
    }

    if ($ambiguous{$name}) { $name = $_; }

    printf "%s %-30s %8d %8d %8d\n", $tag, $name, $cost,
    $frame_size{$_} || 0, $call_depth{$_};
}

print "\n";

print "Peak execution estimate (main + worst-case IV):\n";
printf "  main = %d, worst IV = %d, total = %d\n",
      $total_cost{$global_name{"main"}},
      $total_cost{"INTERRUPT"},
      $total_cost{$global_name{"main"}} + $total_cost{"INTERRUPT"};

print "\n";

print "The following functions were not resolved:\n";
foreach (keys %unresolved) { print "  $_\n"; }
